Most shoppers only spend 5 to 15 seconds looking at your product before deciding whether to buy or bounce. That snap decision depends on many factors, but you won’t know what those are unless you can see how shoppers interact with your content.
It’s a good thing that there are Amazon heat maps that help sellers visualize more than just shopper behavior. From identifying what’s grabbing attention on your listings to spotting inventory gaps and ad performance issues, heat maps give you a clearer view of what’s really happening in your business.
There are different types of heat maps; some track real user behavior, while others focus on backend activity or use AI to predict shopper attention. Each one serves a different purpose and can help you test, validate, and improve content, operations, or ad strategy.
In this article, we’ll break down how Amazon heat maps help sellers visually analyze shopper behavior, sales trends, inventory distribution, and ad performance using color-coded insights. By using tools like Dragonfly AI, PickFu, and Helium 10, sellers can make faster, smarter decisions to boost conversions and fix performance gaps across their listings and backend operations.
Table of Contents
Turn Data Into Sales
If you're tired of guessing what’s working on your Amazon listings, it’s time to back every move with strategy and real data. Our team helps sellers turn insights into action that drives sales.
What Are Heat Maps on Amazon?
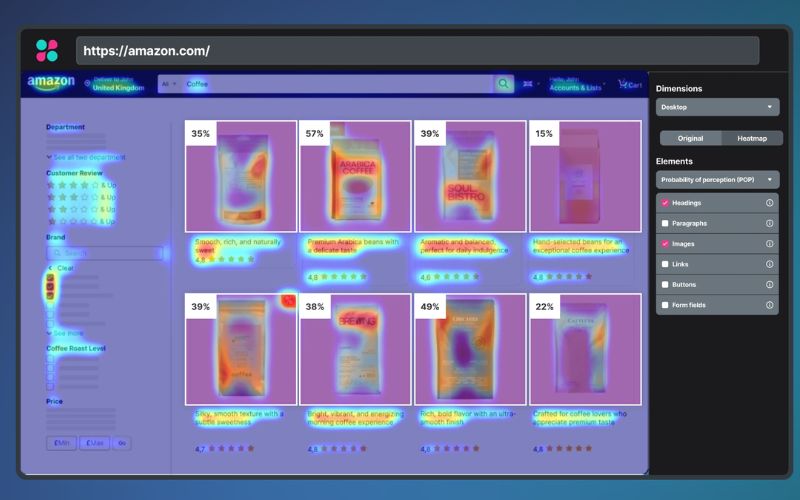
Heat maps on Amazon are visual tools that help sellers see how shoppers interact with their product listings, Brand Store, or ads. Instead of showing only numbers, heat maps display data using color gradients, so you can literally see what’s working and what’s not.
In the context of Amazon selling, heat maps highlight where customers are clicking, how far they scroll, and what elements are drawing attention or being ignored. Warmer colors like red and orange represent high engagement, while cooler colors like blue or green show less interaction.
There are also heat maps designed around performance data that use time-based grids to track sales trends. These allow sellers to spot which days or hours bring the most conversions, helping them time their ads and promotions more effectively.
Benefits of Using Heat Maps on Amazon
There are a lot of valuable insights you can gather from using a heat map, and each one can help you understand how shoppers interact with your listing. When sellers start using heat maps for their Amazon listings and stores, they bring a lot of benefits that directly impact conversion, sales, and user behavior insights.
- Heat maps show exactly where shoppers are clicking, scrolling, and hovering; there’s no guessing involved.
- By focusing on what shoppers look at, you can fine-tune listings that turn more visitors into buyers.
- Higher conversions lead to better keyword ranking on Amazon’s search results, giving you more visibility without extra ad spend.
- Heat maps help you catch problem areas like dead zones that could be blocking conversions.
- You’ll know which images pull the most attention, helping you arrange your stack for maximum impact.
- By understanding visual flow, you can position key benefits and messages where shoppers will most likely see them.
- Before-and-after heat map comparisons let you track the impact of listing updates, so no more blind editing.
- When you know what works, you don’t have to waste money on giveaways, bloated PPC, or ineffective A/B tests.
- Sales heat maps show peak selling days and slow periods, making it easier to plan stock and run promotions.
- Whether it’s listing performance, ad engagement, or Brand Store layout, heat maps give you a fast, visual way to understand and react.
Types of Heat Maps That Can Be Used on Amazon
There are different types of Amazon heat maps, each built to show unique data depending on what your business needs. Some give you insights into shopper behavior on your listing, while others help with backend operations like inventory and sales strategy.
I. Listing Optimization Heat Maps
Listing optimization heat maps show where shoppers are most likely to focus their attention on your product listing. They help sellers understand shopper behavior better by visualizing which areas draw attention and which elements are being overlooked.
A. Predictive Eye-Tracking Heat Maps
These tools use AI to simulate where a shopper’s eyes are most likely to focus when viewing your product images or listing layout. You upload screenshots or creative assets, and the platform generates a heat map based on attention algorithms, so there is no need for live users.
B. Behavioral Heat Maps
This method involves recreating your Amazon listing (or key elements of it) in platforms like PickFu to gather real feedback from human testers. You can compare image stacks, titles, or A+ content to see what grabs attention and drives interest before making changes on Amazon.
II. Operational Heat Maps
Operational heat maps are tools that visualize backend performance data like sales, inventory, and ad results across time, location, or fulfillment centers. By using this type of heat map, sellers can spot trends, fix inefficiencies, and make smarter decisions to boost profitability.
A. Sales by Time and Day Heat Maps
These show which days and hours bring in the most sales, so you can align ads and promotions with high-converting time slots. It helps sellers optimize spend and avoid running ads during low-conversion periods.
B. Sales by Region Heat Maps
These maps reveal where your orders are coming from, broken down by city, state, or country. Sellers use this data to fine-tune regional targeting and plan local inventory distribution.
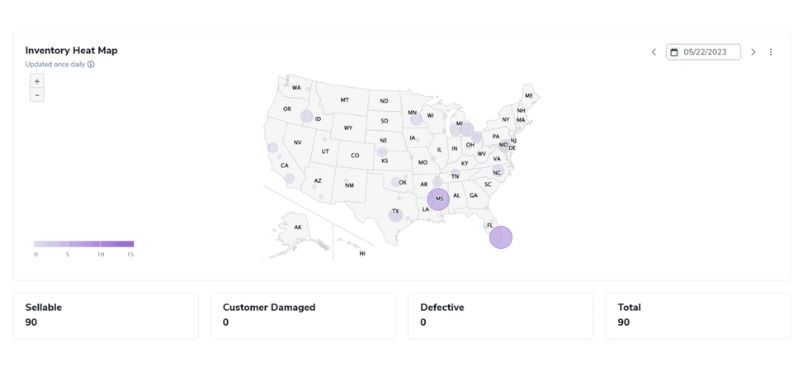
C. Inventory Distribution Heat Maps
These types of heat maps display where your FBA inventory is stored across Amazon’s fulfillment centers. It helps identify stock imbalances that could delay delivery or impact your IPI score.
D. Advertising Performance Heat Maps
Some analytics tools visualize your ad performance by time of day and day of week. These maps help cut wasted ad spend by identifying when your campaigns drive the best ROI.
Top 5 Heat Map Tools for Amazon Sellers
Various heat map tools are already available for Amazon sellers. The right one depends on what you’re trying to fix, your listing visuals, ad results, or sales data, and what fits your budget and skill level.
1. Dragonfly AI
Dragonfly AI uses predictive eye-tracking to instantly show which areas of your listing images or A+ content attract the most attention. It’s ideal for refining your main image and layout to highlight top features and drive clicks.
2. Signalytics
Signalytics offers AI-generated heatmaps that break down shoppers’ focus on your images, showing what captures interest and what distracts. It even includes different viewing modes like “Color Blind” and “Scientific” to optimize listings for various visual needs.
3. PickFu
PickFu’s Click Test lets you run A/B tests with real people and produces a heatmap showing where they clicked the most. It’s a powerful way to gather both visual and written feedback on your main image or A+ modules before launching.
4. Helium 10 Heat Map
Helium 10 visualizes sales, inventory, and keyword ranking trends using color-coded heatmaps. While it doesn’t measure visual attention, it helps you identify where your orders are coming from, how inventory is spread out, and which keywords are improving or tanking.
5. Sellerise
Sellerise shows performance heatmaps based on metrics like sales, CTR, ACoS, and profit across different days and time blocks. This helps you catch trends and take action quickly when something’s underperforming, especially for ad strategy and listing tweaks.
Best Practices for Using Amazon Heat Maps to Boost Conversions
Heat maps are only useful if you take action on what they show. Whether you’re analyzing shopper behavior or backend performance, here are the best practices to turn your heat map data into real improvements.
1. Regularly Check and Optimize
Heat map patterns shift fast, especially after you change your listing, launch a new product, or run aggressive ads. Make it a habit to review your visual, sales, and behavior heat maps weekly (or daily for new listings) to stay ahead of shopper trends and catch conversion leaks before they become costly.
2. Use Visual Heat Maps to Improve Image Hierarchy
Predictive eye-tracking heat maps show where shoppers focus first on your product images. Use that data to place critical info, such as product benefits, pricing visuals, or trust signals, in the areas that get seen, not buried where attention drops off.
3. Let Sales Heat Maps Guide Your Promo Schedule
If your sales-by-day or hour heat map shows consistent peaks and lulls, don’t ignore them. Align your PPC campaigns, coupons, and lightning deals with high-converting times to get more ROI from every dollar spent.
4. Restructure Content Based on Scroll and Click Maps
If your scroll or click maps show shoppers are missing key sections, like FAQs, reviews, or benefit bullets, reorganize your content. Move the highest-impact pieces higher up the page and reduce fluff where users drop off, so every inch of your listing works harder.
5. Fix UX Confusion Spotted in Click Maps
If shoppers keep clicking on images or icons that don’t do anything, they’re getting confused. Use heat map insights to simplify your visuals, clarify your image messaging, and make sure buyers know where to look to learn more or make a purchase, without misleading cues.
From Guesswork to Growth Strategy
It’s time to apply proven, data-backed best practices to optimize your listings, drive conversions, and scale smarter with the help of our expert Amazon team.
Common Mistakes to Avoid With Amazon Heat Maps
Using heat maps the wrong way can lead to poor decisions, wasted time, and lower conversion rates. Below are the common mistakes to watch out for so you don’t sabotage your own CRO strategy:
1. Copying Competitors Instead of Using Real Data
There’s nothing wrong with checking out your top competitors, but don’t blindly copy what they’re doing. Your heat maps reflect your actual customer behavior, so trust that data first before mimicking someone else’s strategy.
2. Ignoring Mobile Users
Over 60% of Amazon shoppers are on mobile, and the layout for mobile and desktop views can differ significantly. If you only analyze heatmaps for desktop users, you’re missing out on key behavior insights from the majority of your actual audience.
3. Not Reviewing Heat Maps Regularly
Heat maps aren’t one-and-done reports since they reflect changes over time. Skipping regular reviews means you’re reacting late to listing issues that could have been caught early.
4. Having Misleading Elements
If shoppers are clicking on icons, badges, or images that aren’t interactive, it shows they expect those elements to do something. Heat map behavior like this tells you it’s time to rethink your design so shoppers see what matters, and aren’t distracted by misleading visuals.
5. Skipping Image Stack Adjustments
Each image in your stack should have a clear purpose: confirmation, education, or persuasion. If the heat map shows people ignoring certain images, reorder or replace them based on what’s getting the most attention.
FAQs About Amazon Heat Maps
Do Amazon Seller Central accounts offer heat maps?
No, Amazon doesn't provide built-in heat maps. You'll need third-party tools to analyze shopper behavior visually.
What’s the difference between predictive and behavioral heat maps?
Predictive heat maps use AI to forecast where shoppers might look, while behavioral heat maps are based on actual user actions like clicks, scrolls, and mouse movement.
How often should I check Amazon heat maps?
At least once a week. For new launches or big promos, check daily so you can catch and fix issues fast.
Make Smarter Decisions With Amazon Heat Maps
A big part of being an Amazon seller is analyzing data to make smart decisions that lead to more sales and less wasted effort. Luckily, tools like Amazon heat maps make it easier to see what’s working, what’s not, and where to focus your energy for better results.
In this guide, we broke down what heat maps are, the different types available, and how to use them to boost conversions and tighten up operations. We hope this gives you the clarity and confidence to make data-backed changes that actually move the needle.
Struggling to make sense of your Amazon heat map or performance data? Let our Amazon agency help you break it down and turn those insights into real sales growth.
Too Much Data, Not Enough Clarity?
If your heat maps and metrics aren’t turning into better sales, let our experts help you spot what matters and build a strategy that actually works.


