You rank on page one for your best keyword, so why does a competitor keep walking away with the sale? Amazon search query performance market share shows you exactly where those buyers slip away and how to win them back.
This guide walks you through the four shares inside the Search Query Performance report, or SQPR, so you can spot the one funnel stage leaking your sales. You’ll also learn how to score each keyword by the dollars a fix could add, so you know where to spend your time first.
We’ve managed $1.4B+ in ecommerce revenue, and this is the same six-step Phase 4 process our team runs when a hero ASIN stalls. It covers what to track each week, advanced moves for mature brands, and a real client result that came from reading share data.
Our Amazon agency talks about how to read market share in the SQPR and turn it into more sales in this guide. We also discuss the Share Ladder, the five leak patterns, and the numbers worth tracking each week.
Table of Contents
Send us one hero ASIN and we’ll show you which rung of its Share Ladder is losing the sale.
TL;DR - Amazon Search Query Performance Market Share
The Search Query Performance report shows how much of each keyword’s traffic and sales your brand wins. Phase 4 of our SEO framework uses that data to grow your slice of keywords you already rank for.
- Share beats rank for revenue
- Read four shares as rungs
- The biggest drop names the leak
- Score keywords in sales dollars
- Fix leaks before buying traffic
Page-one rank only gets you in front of shoppers, while share proves they chose you. Pull your last 13 weeks of SQPR data and find the rung where your share drops first.
What Is Amazon Search Query Performance Market Share?
Market share in the SQPR is your brand’s slice of everything Amazon logged for one keyword in a set period. It tracks four stages: impressions, clicks, cart adds, and purchases, so you can see exactly where shoppers chose you or walked away.
What Does Brand Share Mean in the Search Query Performance Report?
Brand share is your brand’s count divided by the total count for that keyword at each funnel stage. If a keyword drove 1,000 purchases last month and 40 went to you, your purchase share is 4%.
Switch to the ASIN view and the same math runs for one product, which Amazon labels ASIN share. Use brand share to judge your whole catalog and ASIN share to judge each hero listing.
Why Does My Listing Rank on Page One But Not Get Sales?
A page-one spot gets you seen, but the main image, price, reviews, and delivery promise decide who earns the order. Rank tells you where you showed up, while share tells you how many shoppers actually picked you.
We see this every week with brands doing $1M to $20M a year, where a hero ASIN holds position five and still loses most buyers to a sharper offer. That gap is exactly what Phase 4 market share indexing is built to close.
What Do Sellers Get Wrong When They Read the SQPR?
Most mistakes come from reading one column alone or trusting one week of data. These are the three we fix most often.
- Treating brand share as category share
- Reading one week as a trend
- Letting branded keywords inflate share
The report also doesn’t separate sponsored and organic traffic, and it leaves out keywords with tiny search counts. Pair it with your ad reports and focus on the keywords that move revenue.

The Greatest Data Amazon Has Ever Given Sellers Is the SQPR
The Share Ladder for Amazon Keyword Market Share
Think of the four SQPR shares as rungs on a ladder that every shopper climbs from search to checkout. The rung where your share drops the hardest tells you what to fix and who on your team owns it.
Which Four Shares Should You Read in the SQPR?
Every keyword row in the report gives you four shares. Read them top to bottom in this order.
- Impression share, how often shoppers saw you
- Click share, how often they picked your tile
- Cart add share, how often the page convinced them
- Purchase share, how often you closed the sale
Impression share measures visibility, while click share shows whether your search result beat the tiles around it. Cart add and purchase share show whether your detail page and your offer finished the job.
Why Is My Click Share Higher Than My Purchase Share?
Your search result wins the click, but the detail page or the offer loses the sale. That’s one of five patterns we see in almost every account.
| Pattern | Warning sign | First fix |
|---|---|---|
|
Visibility gap
|
Few impressions
|
Index it and run exact match
|
|
Click leak
|
Clicks below impressions
|
Test a new main image
|
|
Cart leak
|
Cart adds below clicks
|
Upgrade A+ and reviews
|
|
Checkout leak
|
Purchases below cart adds
|
Check price and delivery
|
|
Hidden winner
|
Purchases above impressions
|
Buy more visibility
|
The pattern tells you which team moves first, so nobody burns budget fixing the wrong rung. Our main image CTR upgrade and A+ Content work usually starts here.
What Is a Good Purchase Share on Amazon for a Keyword?
There’s no universal number, because 3% in a crowded category can beat 20% in a tiny niche. A better test is whether purchase share sits at or above impression share, which means you convert the visibility you earned.
For a $1M to $3M brand, watch the trend more than the level. Purchase share that climbs quarter over quarter on your top ten non-branded keywords is the benchmark that matters.
Our team will map your impression, click, cart add, and purchase share and pinpoint the first fix.
How to Read Search Query Performance Report Data in Phase 4: Step by Step
Phase 4 turns the SQPR from a report you glance at into a weekly routine. These six steps are the same ones our brand managers run for full-service clients.
Step 1: Confirm Your ASIN Is Ready for Phase 4
Phase 4 works on mature listings that already index 800+ keywords and have finished strike zone work. If you’re below that bar, go back to Phase 1 search term optimization first.
Strike zone keywords and market share keywords are different targets. Phase 3 pushes terms ranked 20 to 50 into the top 19, while Phase 4 grows your slice of terms you already rank for.
Step 2: Pull 13 Weeks of SQPR Data
Open the Search Query Performance dashboard under Brand Analytics, pick the weekly view, and download the CSV for each of the last 13 weeks. Only 21 of the 33 columns show by default, so switch on the price and delivery speed columns first.
Pull both views, since the brand view covers your whole catalog and the ASIN view isolates one product. Sort by search query score to start with the keywords Amazon ranks as most important to your brand.
Step 3: Find Where Your Share Drops
Subtract each share from the one above it for every keyword. The biggest drop is your leak, and the pattern table above tells you what to fix.
Keep it simple in a spreadsheet with one row per keyword and one column that names the weakest rung. Fix the highest leak first, since a broken click rung starves every rung below it.
Step 4: Rank Keywords by Sales Upside
Calculate keyword market share upside in dollars, not percentages. Multiply weekly search volume by the category purchase rate, the share points you want to gain, and your average price.
Say a keyword gets 20,000 searches a week with a 4% purchase rate, so about 800 buyers. Moving your purchase share from 5% to 8% adds roughly 24 orders a week, or about $960 at a $40 price.
Step 5: Fix the Leak Before You Raise Bids
Fix the leaking rung first, then buy traffic. Bidding harder into a click leak just pays more for the same lost shoppers.
For SEO, move high-converting keywords toward the front of your title, bullets, and backend terms. For PPC, give each priority keyword its own exact match campaign so you can read the share change cleanly.
Step 6: Log Changes and Recheck Your Share
Log every change with its go-live date, then recheck the keyword at four and eight weeks. Change one big lever at a time, because a new image and a price cut in the same week hide which one moved share.
Every MAG change also goes through brand manager review for prohibited terms and client approval. That habit keeps your change log clean and your listings safe.
How to Use Search Query Performance to Build an Amazon Strategy
Case Study: How Phase 4 Lifted a Hair Care Brand’s Conversions by 12.4%
A personal care brand came to us with 24 SKUs and a flood of low-cost rivals eating into its sales. Our team ran phased SEO and pulled share data every cycle to find the high-intent keywords worth the fight.
Conversion rate rose 12.4% year over year. The brand kept TACoS in single digits for all of 2024 while spending 89% less on ads each month and still earning a 6.5 ROAS.
What to Track in the Search Query Performance Report and How Often
Check the SQPR weekly, but expect the data to land several days after each week closes. This simple cadence helps you catch leaks early without drowning in data.
| What to track | How often | Why |
|---|---|---|
|
Four shares, top 20 keywords
|
Weekly |
Catch leaks early
|
|
Organic rank
|
Weekly
|
Confirm SEO sticks
|
|
Purchase share trend
|
Monthly
|
Spot gains or losses
|
|
Brand vs ASIN view
|
Quarterly
|
Find self-competition
|
Weekly checks catch a leak before it costs you a month of sales, while monthly and quarterly reviews confirm the trend. Three straight months of rising purchase share is a win worth repeating across your catalog.
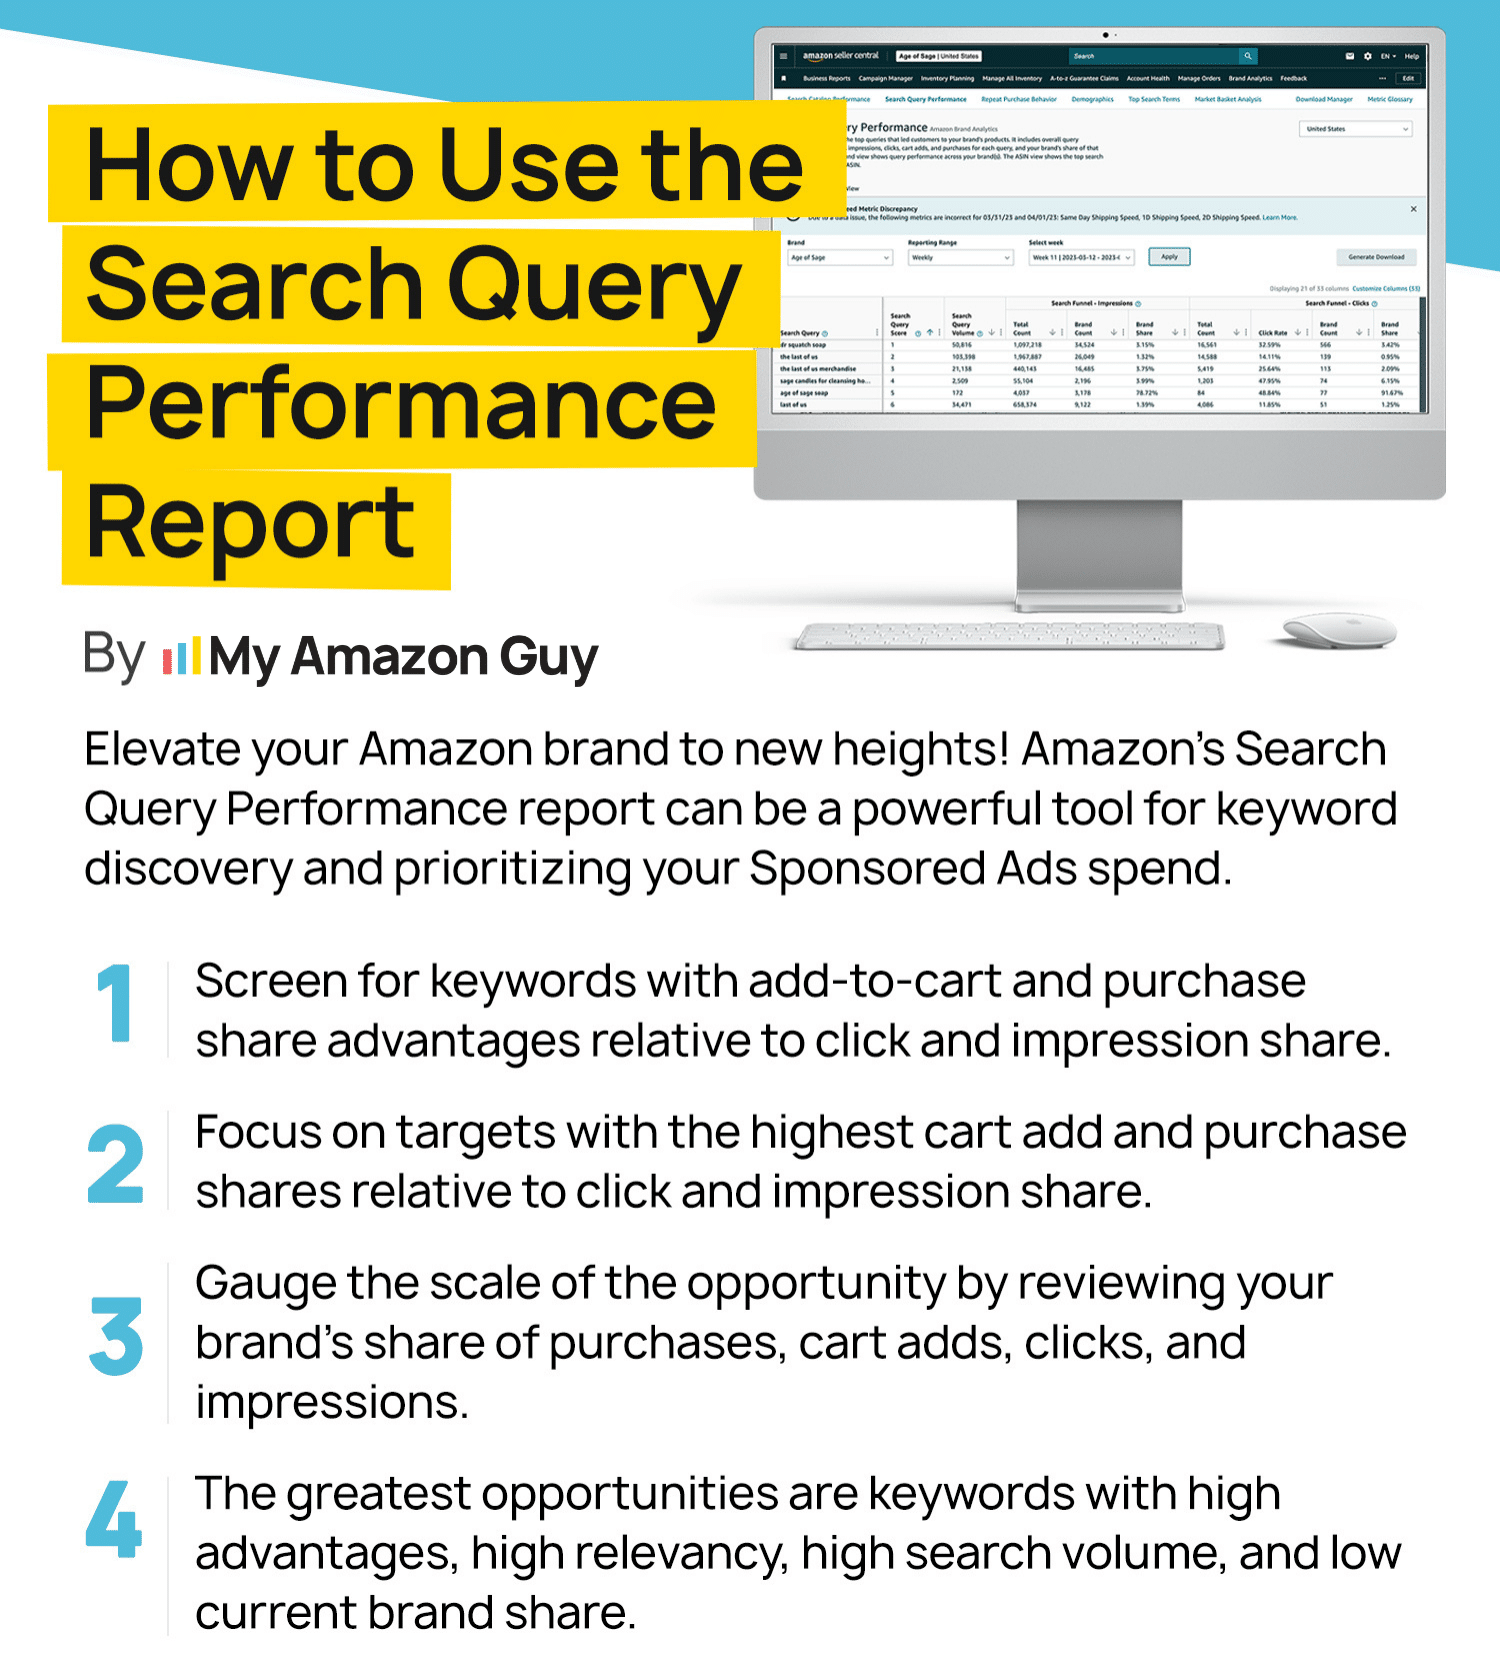
How to Use the Search Query Performance Report
Advanced SQPR Tips for Mature Brands Defending Market Share
Once the basics run on autopilot, two extra moves give you an edge. Both work best for brands doing $5M or more on Amazon.
1. Compare Your Price to the Keyword Median
The SQPR shows the median price for each keyword and the median price across your brand’s products. If your price sits well above the keyword median, a checkout leak may be a pricing problem, not a listing problem.
Check that column on any keyword with a checkout leak before you rewrite a single bullet. A small coupon or a tighter price often closes the gap faster than new creative.
2. Automate Your SQPR Pulls With the SP-API
Amazon added the Search Query Performance report to the Selling Partner API in February 2025. Since June 2025, one request can cover several ASINs at once.
Feeding those pulls into a sheet or dashboard saves your team hours of weekly CSV downloads. It also builds a clean history, so you can spot share trends across every hero ASIN at once.
Frequently Asked Questions About Brand Analytics Purchase Share
Does the Search Query Performance report include PPC traffic?
Yes, the SQPR counts paid and organic traffic together in the same numbers. It doesn’t split them, so check your ad console to see how much came from ads.
How do I see competitor market share for a keyword on Amazon?
Subtract your share from 100% to see what all other brands hold combined. Then open Amazon’s Top Search Terms report to see the top three products winning that keyword.
What is the difference between Search Query Performance and the Search Terms report?
The SQPR shows your full funnel for a keyword across paid and organic search. The Sponsored Products search term report only shows searches that triggered your ads, so use it for bids and negative keywords.
Turn Amazon Search Query Performance Market Share Into Real Sales Growth
Rank gets you on page one, but Amazon search query performance market share tells you whether shoppers actually choose you. Read the four shares as a ladder, and the biggest drop shows exactly which part of your listing or offer is leaking sales.
Score each keyword in dollars, fix the leaking rung before you buy more traffic, and recheck your share every four weeks. That repeatable loop is what Phase 4 is built to run for brands that already rank.
Are you ranking on page one but still losing the purchase? Contact our full-service Amazon agency and let our Amazon experts turn your SQPR data into market share.
We’ll rank your top keywords by the dollars a share fix could add, just like our hair care client.